


Air Quality
A Breath of Fresh Air
San Antonio is a big city blessed with a warm climate, robust economy, and growing population. But like all big cities, those blessings also present challenges that may threaten our collective well-being. One of those challenges is keeping our air clean – the air that we breathe every day and on which all life depends. Our air doesn’t look particularly dirty, but the truth is we have surpassed the U.S. Environmental Protection Agency’s (EPA) health-based clean air standards. Therefore, it’s important for us all to work together to reduce pollution and clean up our air.
Air pollution can be caused by many things, including burning of fossil fuels for power generation, industrial manufacturing and refining, and driving our vehicles. By reducing our energy use and finding more sustainable ways to get around our City, we will work together to keep our air clean.

Air Quality
What is Ozone?
Ground-level ozone is the major component of smog and is the result of both uncontrollable and controllable factors. The uncontrollable factors are sunlight, high temperatures, and low winds. The controllable factors are the emissions released when we drive our vehicles and lawnmowers that run on gasoline and diesel and from paints, solvents and fuels. When the uncontrollable factors combine with controllable factors we get a rise in ozone. To improve air quality in San Antonio, reducing emissions from combustion engines is critical.
UNIT | We determine the amount of ozone in the air by measuring its concentration in "parts per billion" (ppb). To help visualize this, consider one drop of ink in a large gasoline tanker truck. This would be the equivalent of about 1 ppb of ink. | ppbParts per Billion |
We determine the amount of ozone in the air by measuring its concentration in "parts per billion" (ppb). To help visualize this, consider one drop of ink in a large gasoline tanker truck. This would be the equivalent of about 1 ppb of ink. | ppbParts per Billion |
Air Quality
Air Quality
2015
2016
2017
2018
2019
2020 - Goal
San Antonio is striving to meet the Federal Air Quality Ozone Standards 70 ppb for air pollution.
Air Quality
What is "Non-Attainment"?
When the average annual amount of air pollution like ozone in our City's air is found to be higher than the ‘threshold’ level, as defined by the U.S. Clean Air Act to keep our air healthy, then our City is in "non-attainment". Areas with all air pollutants below those levels are considered in attainment. Learn more about air quality in San Antonio.
One way the City is achieving this goal is through its Anti-Idling Ordinance. Idling can burn up to a gallon of fuel per hour needlessly and those numbers can add up quickly when multiplied by the number of vehicles in San Antonio. This is a small but effective way to bring down local air pollution levels.
Air Quality
How San Antonio is Monitoring Air Quality
Our ozone levels are measured by a network of air quality sensors located throughout Bexar County. These sensors are operated 24 hours per day, 7 days a week to continuously monitor the air we breathe.
Whether we meet Federal standards depends on a number of factors including how attainment levels are determined. A three-year average is calculated for each of Bexar County's monitors. At the end of the year, the highest of the three-year averages is considered the “design value” for Bexar County. In 2015 the highest value was 78 at Camp Bullis. The same logic was applied to the following years, so a high reading at a single site can have a big influence on whether we meet the standard.
Did you know?
Ozone in the air can be harmful, especially on hot sunny days when ozone pollution can reach unhealthy levels. Even relatively low levels of ozone can cause health problems and can be serious in people with respiratory diseases such as asthma. Children, the elderly, and outdoor workers are most sensitive to increased levels of ozone. A recent study estimated that increases in ozone levels in San Antonio results in 19 deaths each year and that improvements in ozone levels could lead to 24 avoided deaths
Have you Signed up for Ozone Alerts?
Sign up with the Texas Commission on Environmental Quality (TCEQ) to get notified when ozone levels will be high the following day. With this information, you can act to keep our community healthier and safer! Simply click the link below and sign up for Ozone Action Alert under the Forecasts and Alerts subject. Learn more about how we're keeping our air clean in our Ozone Action Day Plan!

Water Conservation and Protection
Protecting our Water Supply
San Antonio is growing to ensure that our entire community has access to a safe, reliable, and secure water supply for years to come. The Edwards Aquifer is our primary source of water. It is a unique groundwater system and one of the greatest natural resources on Earth. We need to be conscious of how much water we draw from it, so we have that supply in the long term. The San Antonio River provides us with a sense of place. It brings our community together. Protecting these valuable water sources will, in turn, protect the health and well-being of each of us as well as our natural resources.
UNIT | We measure water conservation by determining the average amount of water each person in San Antonio uses every day. | gal/pp/dayGallons per person per day |
We measure water conservation by determining the average amount of water each person in San Antonio uses every day. | gal/pp/dayGallons per person per day |
Water Conservation and Protection
Water Conservation and Protection
1992
2014
2016
2018
2019
2040 - Goal
San Antonio has a goal to reduce water consumption to 96 gallons per person per day
Water Conservation and Protection
Where Our Water Comes From
San Antonio Water System (SAWS) recognizes that it is important to source our water needs from a variety of places to ensure that we always have the supply that we need. As our population grows, so will the demand on our water supply. This image shows you where our water came from in 2017 and where it will come from in 2070. You’ll see the amount of water we obtain from each source changes depending on whether we are experiencing drought or normal conditions. During droughts, we rely more heavily on recycled and recovered water and other water bodies besides the Edwards Aquifer.
Wan to learn more? Then check out our Water Conservation Plan.

Water Conservation and Protection
Saving Water Today is an Investment in Our Future!
There are many ways each one of us can reduce the amount of water we use.
San Antonio Parks
Places to Gather
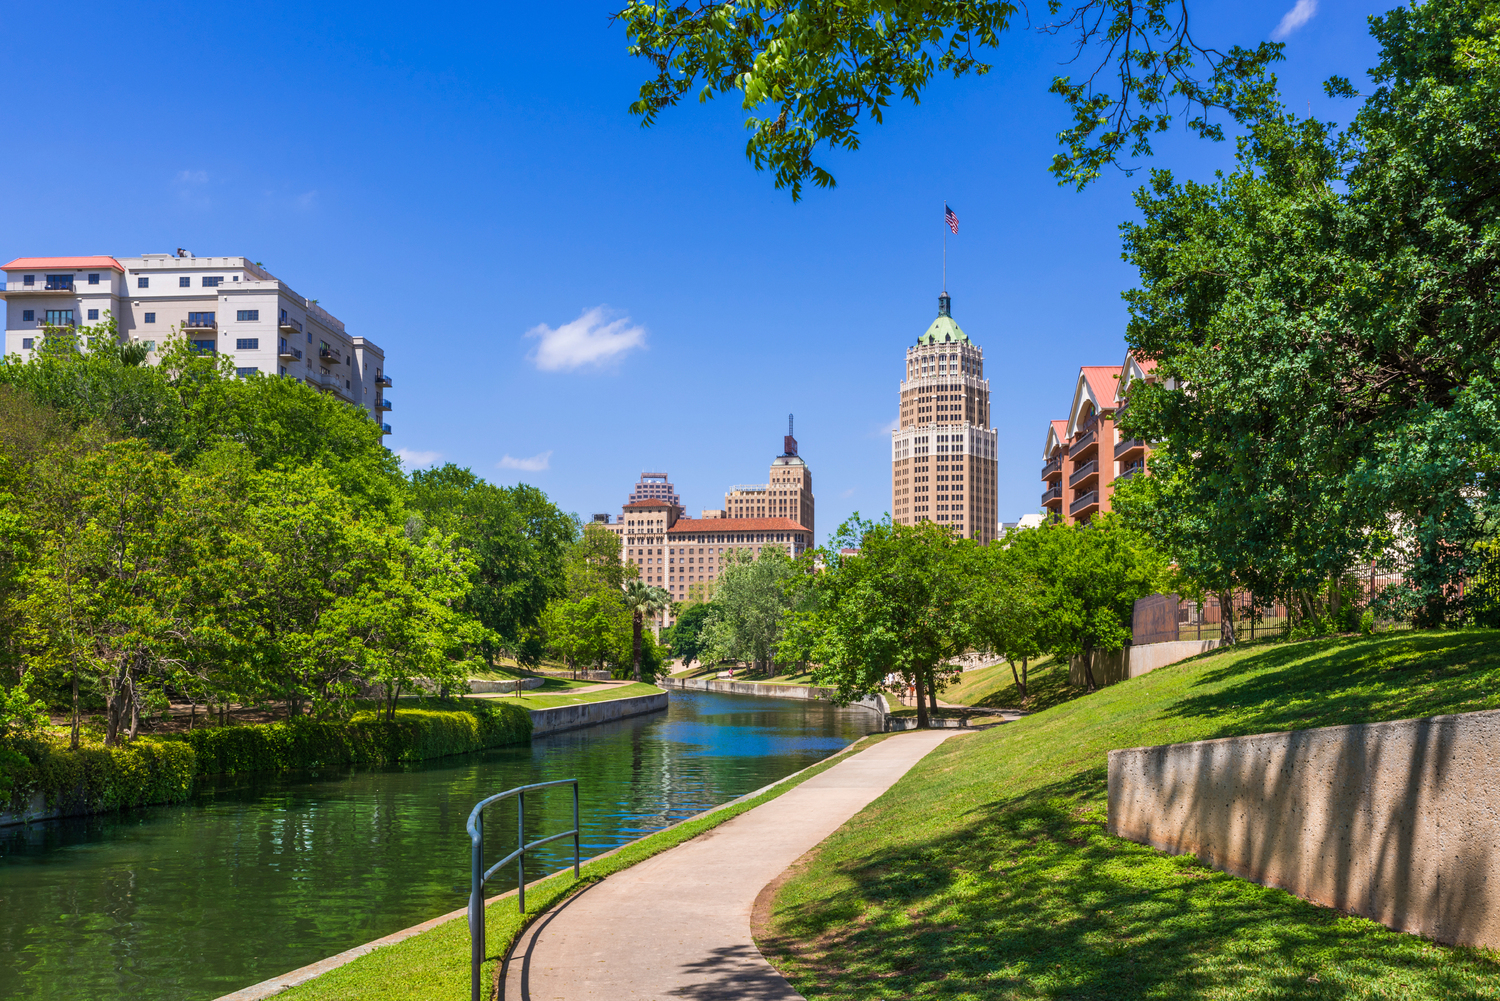
San Antonio's parks are places where families, friends, and neighbors can gather and celebrate. These parks are places where we all can take a break, enjoy nature, and breathe clean, fresh air. Protecting and enhancing our parks is a direct investment in our health and well-being, our community, and our environment.
San Antonio Parks
Our Park System
San Antonio's Park System covers 10% of our City, with each park averaging over 11 acres in size! In fact, 38% of all San Antonio residents currently live within a 10-minute walk of a park and we're working to increase that percentage - especially for those areas of the city considered underserved. Check out our Parks Department to learn more.

San Antonio Parks and Recreation
Programs and Fun at San Antonio Parks
The Parks and Recreation Department offers something for everyone when it comes to recreational fun, fitness, learning, and life-long growing. We offer an enormous variety of programs and classes to fit your every need. Music, dance, art, fitness, sports—you name it, and you have the opportunity to explore new vistas and develop new interests. Start now by exploring all the fun the Parks and Recreation Department has to offer!
San Antonio Parks
Find Out What's Going on at Your Parks!
Your San Antonio Parks and Recreation facilities have a lot to offer! Check them out today!

Tree Canopy and Natural Habitat
Tree Canopy
Trees provide many benefits to our community, such as improving water quality, reducing stormwater runoff, lowering summer temperatures, reducing energy use in buildings, improving air quality, enhancing property values, improving human health, and providing wildlife habitat. The City is actively working to increase the number of healthy trees we have so we can maximize the benefit from this natural resource.
UNIT | Percent tree canopy describes the proportion of the total land that is covered by tree branches and leaves. | %Percent Tree Canopy |
Percent tree canopy describes the proportion of the total land that is covered by tree branches and leaves. | %Percent Tree Canopy |
Tree Canopy Goals
2014
2040 - Goal
San Antonio aims to have 40% of our city covered with tree canopy by 2040. This is in addition to our parks!
Tree Canopy and Natural Habitat
San Antonio's Tree Canopy Map
This map shows the overall tree canopy coverage in San Antonio. The City is strategically increasing the amount of tree canopy across San Antonio, focusing on those areas where people need it most. These areas include streets that typically have many walkers and bus stops in low income neighborhoods. Creating more tree canopy in these areas will provided needed shading to our community, reducing the air temperature and increasing our air quality.


Tree Canopy and Natural Habitat
EquiTree Program
Data gathered by the United States Forest Service demonstrates that census tracts deemed more “socially vulnerable” — a categorization based on factors such as poverty, lack of vehicle access, and crowded housing — have less tree coverage. That also correlates with the city’s equity matrix, which quantifies disparities in race and income in San Antonio: the higher the score, the higher the number of low-income people and people of color in that census tract.
A map of San Antonio with Highest Need and Lowest Need areas shaded is next to a chart indicating the types of trees, amount of area, and other factors for each color.
Did you Know? Tree Canopy Edition
Having a large, healthy tree canopy in our city not only looks nice and provides needed shade when we're walking around but it is also an important part of our approach to making San Antonio more prepared for our changing climate.
Tree Canopy and Natural Habitat
Tree City of the World
Since 2016, San Antonio has been nationally recognized as a Tree City USA. And in October 2023, San Antonio became the first city in Texas and one of only 39 in the US to be globally recognized as a Tree City of the World!
To achieve this recognition, San Antonio met five core standards set forth by the Arbor Day Foundation including:
Establish Responsibility
San Antonio successfully designated a dedicated team and staff member within the City administration who are responsible for tree management and conservation, ensuring a coordinated and effective approach to tree care and preservation.
Set the Rules
San Antonio established and implemented comprehensive tree policies and regulations that safeguard our urban canopy, providing clear guidelines for tree protection and maintenance.
Know What You Have
San Antonio has taken a significant step by earmarking funding and identifying the pressing need to develop a comprehensive inventory of our city’s trees. This effort enables the City to track tree health, growth, and needs, thereby ensuring informed decision-making for effective tree management and preservation.
Allocate Resources
San Antonio allocated the necessary resources to support tree planting, maintenance, and education programs, demonstrating the City’s commitment to sustainable urban forestry.
Celebrate Achievements
San Antonio celebrates and showcases the City’s collective commitment to cultivating a greener and more sustainable community through free annual events.

Tree Canopy and Natural Habitat
Natural Habitat
San Antonio serves as a national model for respectful stewardship of the City’s natural resources. We value our natural resources for their social, ecological, and economic benefits. We are strategically developing natural areas that support healthy animals, plants, and insects. Our drought-tolerant green spaces will incorporate native plant species so that native animals and insects, like monarch butterflies, can thrive.
Did you Know About the Monarchs?
San Antonio has committed to the National Wildlife Federation’s “Mayor’s Monarch Pledge,” by working with partners to enhance habitats for pollinating insects and to educate and encourage the greater community to support this initiative.
Tree Canopy and Natural Habitat
Create Your Own Natural Habitat!
Each and every one of us can play a role to help improve our natural resoruces.